| difference between the highest and lowest points within each site of a clamped wafer Note 1 to entry: A site map example is shown in Figure 23. The value is always a positive number and is defined for each site as the difference between the highest and lowest points within each site, as shown in Figure 24. For a wafer to meet a local thickness variation specification, all sites must have local thickness variation values less than the specified value. Note 2 to entry: This note applies to the French language only. 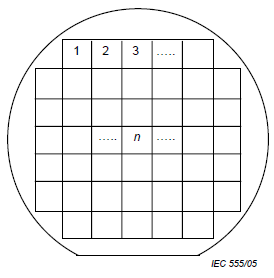
NOTE All sites have their centres within the fixed quality area. Figure 23 – Example of site distribution for local thickness variation measurement X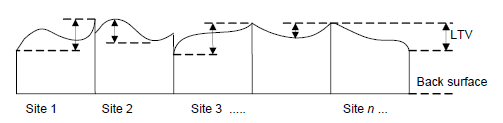 NOTE Local thickness variation is a positive number. Figure 24 – Local thickness variation measured at each site
|